```{ojs}
//| echo: fenced
d3 = require('d3')
books = await d3.json(
// This is my live API so it runs in your browser.
// Use your local API URL on your computer.
"https://api.andrewheiss.com/books_simple?year=2023"
)
Plot.plot({
title: books.count[0] + " books read in 2023",
y: {
label: "Books read",
grid: false,
percent: false
},
x: {
label: "Month",
domain: books.monthly_count.map(d => d.read_month_fct),
},
marks: [
Plot.ruleY([0]),
Plot.axisX({label: null, ticks: null}),
Plot.axisY({label: null, ticks: null}),
Plot.barY(books.monthly_count, {
x: "read_month_fct",
y: "count",
fill: "#f3752f",
tip: {
format: {
x: true,
y: true
}
}
})
]
})
```8 Getting Goodreads data with a GET endpoint
Ok, so with that, let’s create an actual endpoint that uses {googlehseets4} to grab data from our Google Sheet, clean it up, and return it as JSON. For bonus fun, we’ll offer a couple different versions of it to simplify plotting.
8.1 Endpoint code
For the sake of brevity, and because I’m assuming you know {tidyverse}-flavored R, I’ll just include an annotated version of the code here.
#* Get and clean Goodreads data
#* @serializer json
#* @tag Data
#* @get /books
function(year = 2024) {
  library(googlesheets4)

  gs4_deauth()  # The sheet is public so there's no need to log in
  local_gs4_quiet()  # Turn off the googlesheets messages

  books_raw <- read_sheet("https://docs.google.com/spreadsheets/d/1oQqX4G4CJaa7cgfsEW4LeorcQwxVeYe0Q83WrJbcN6Y/edit#gid=0")

  books_clean <- books_raw |>
    # Convert the timestamp to an actual date
    mutate(timestamp = dmy_hms(user_read_at)) |>
    # Make some extra helper columns
    mutate(
      read_year = year(timestamp),
      read_month = month(timestamp),
      read_month_fct = month(timestamp, label = TRUE, abbr = FALSE)
    ) |>
    # Only keep books for the specified year
    filter(read_year == as.integer(year)) |>
    # Only include a few columns
    select(
      timestamp = user_read_at,
      book_title = title,
      book_author = author_name,
      rating = user_rating,
      read_year, read_month, read_month_fct
    )

  # Find the count of all the books
  total <- books_clean |> nrow()

  # Calculate the number of books by month
  monthly_count <- books_clean |>
    group_by(read_month_fct, .drop = FALSE) |>
    summarize(count = n())

  return(
    list(
      count = total,
      monthly_count = monthly_count,
      full_data = books_clean
    )
  )
}
8.2 Using the endpoint
8.2.1 From the documentation
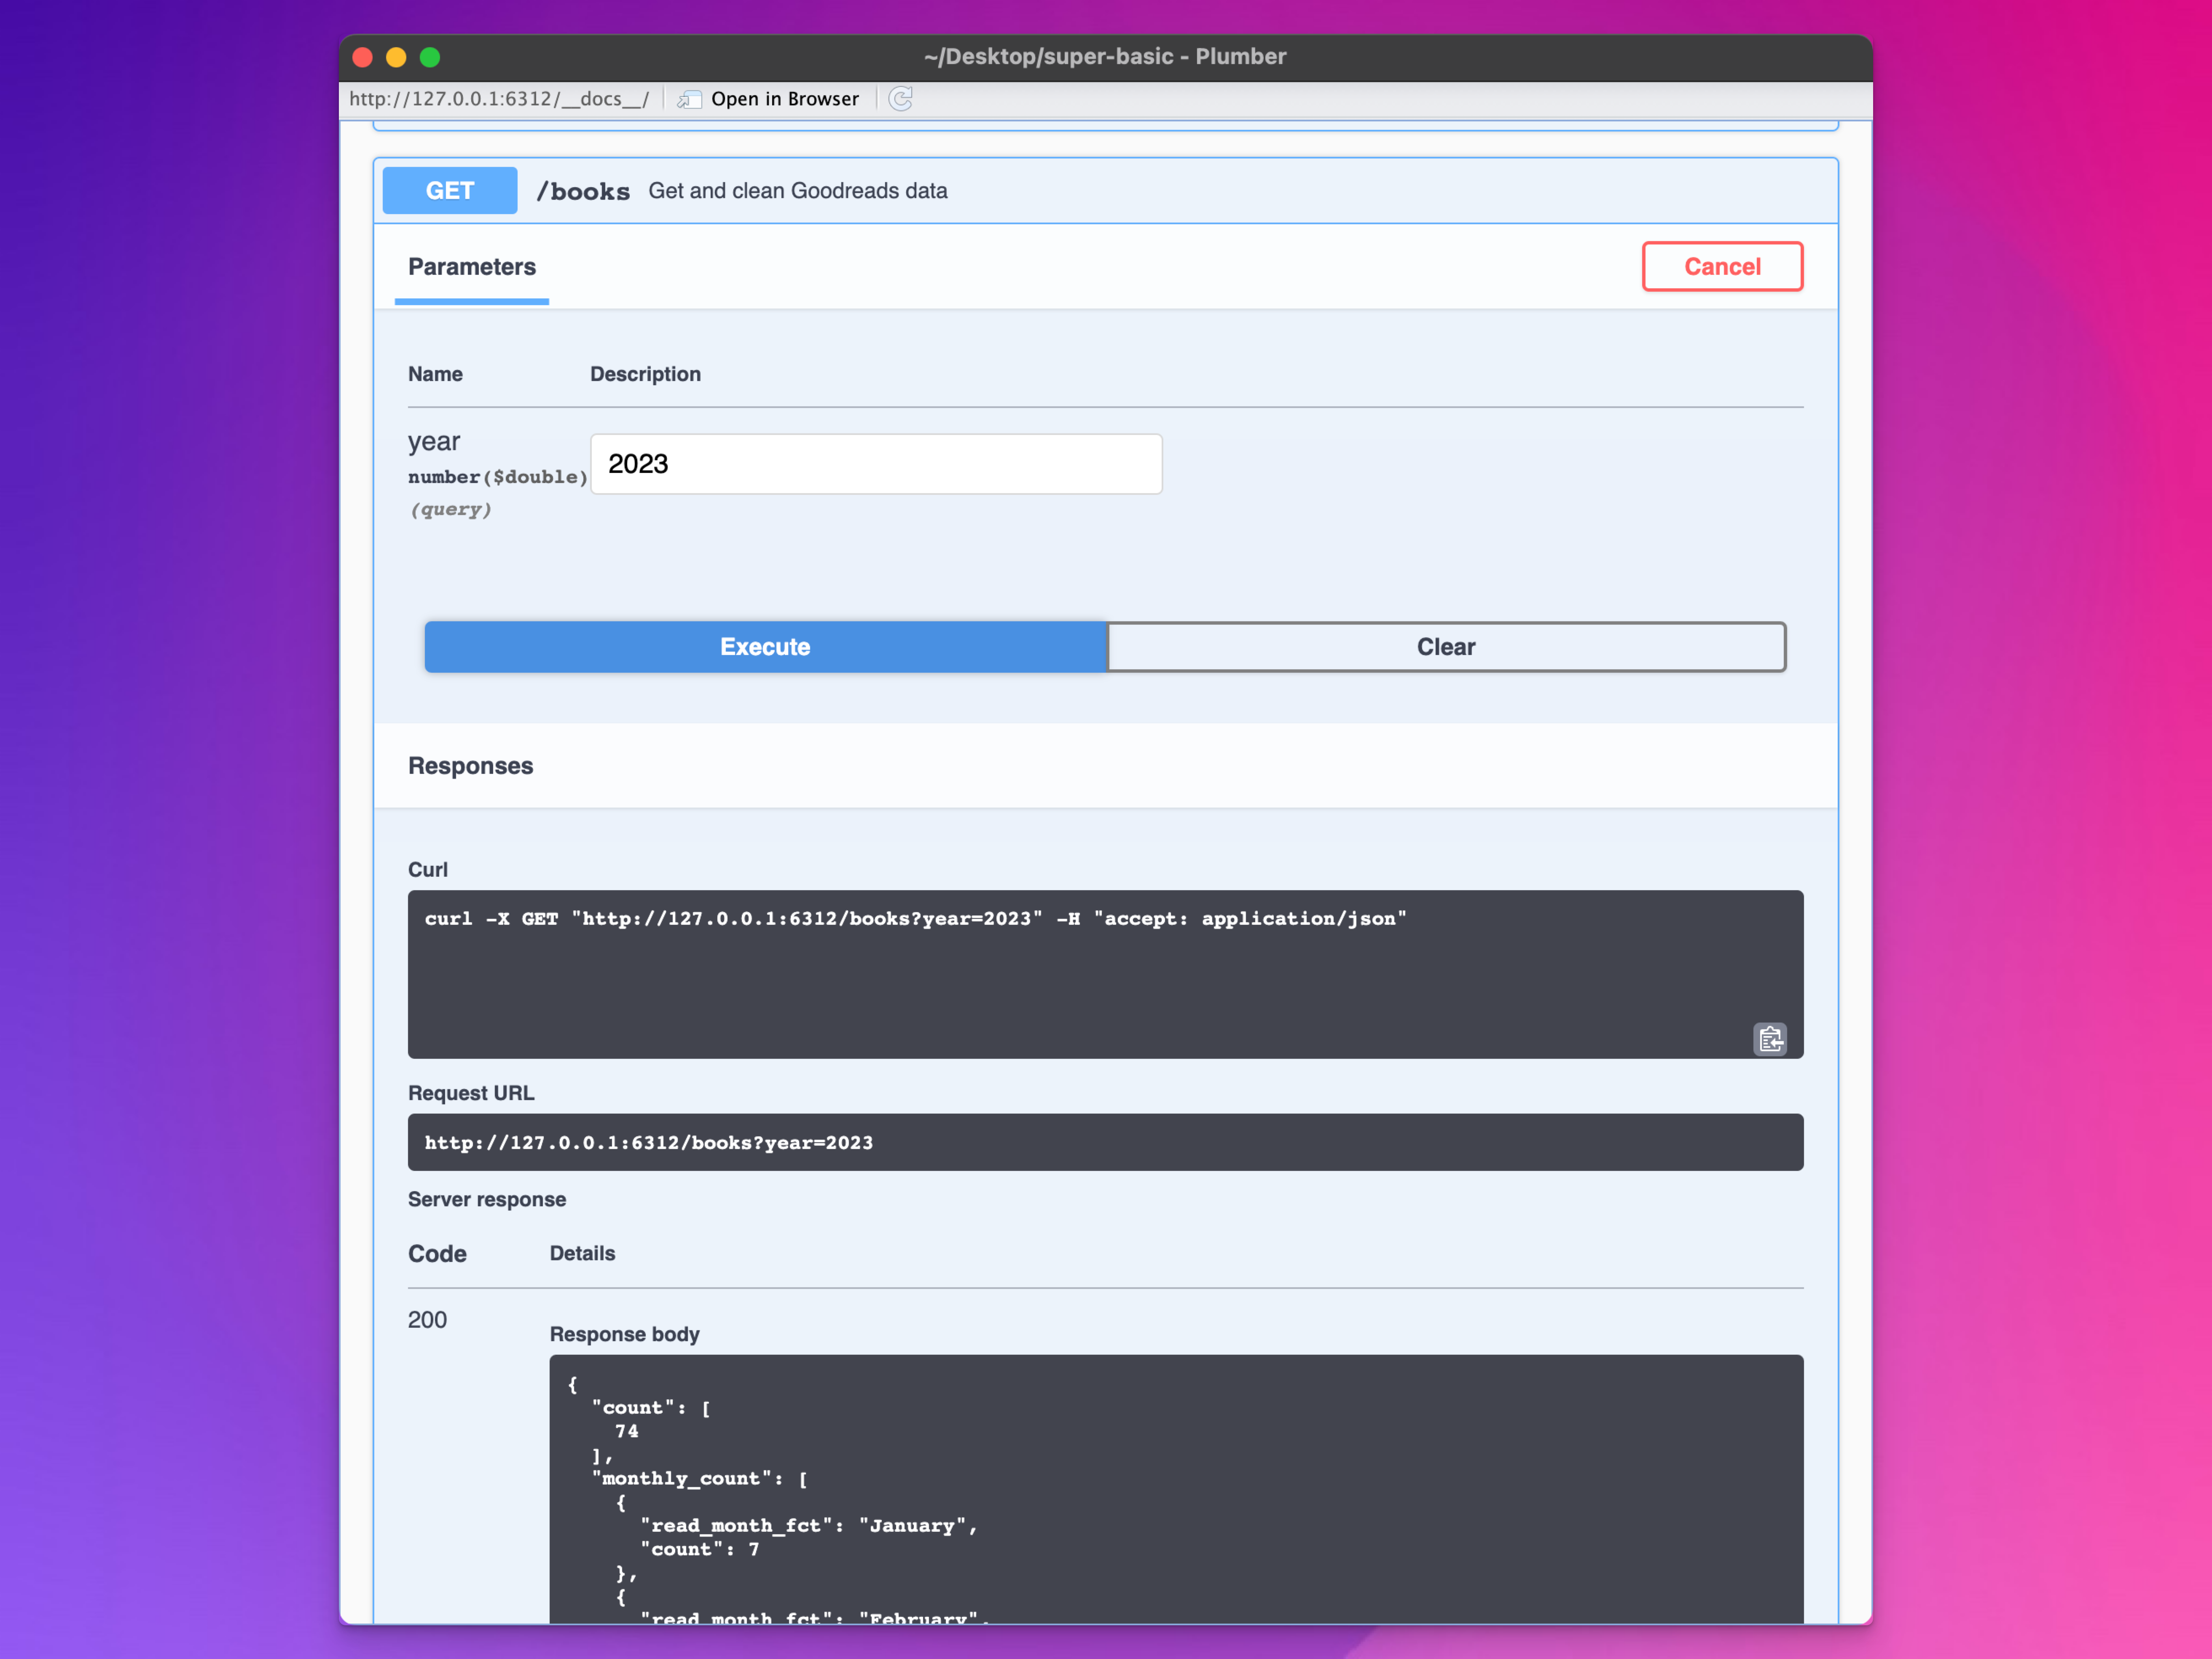
Run your API and you should see a new endpoint in the documentation for /books. It has a parameter for specifying the year and it’s set to 2024, but at the time of this writing, I’ve only read 1 book this year, so change it to 2023 to get more data. Try running a command from the documentation, or go to http://127.0.0.1:6312/books?year=2024 in your browser (but change the URL to whatever {plumber} is using), and you should get a JSON file with the count of books, a count of books by month, and a list of all the books.
That’s so cool! It’s a live (as of at most two hours ago) list of all the books recorded in Goodreads. Make handles the regular backend updates—all we have to do is visit a single URL.
8.2.2 With R
We can use it in R:
library(jsonlite)

books_raw <- read_json(
  "http://127.0.0.1:6312/books?year=2023",
  # Automatically convert dataframe-like elements to data frames
  simplifyVector = TRUE
)

books_raw$count
#> [1] 74

books_raw$monthly_count
#>    read_month_fct count
#> 1         January     7
#> 2        February     9
#> 3           March     6
#> 4           April     8
#> 5             May     5
#> 6            June     4
#> 7            July     5
#> 8          August     2
#> 9       September     7
#> 10        October     5
#> 11       November     6
#> 12       December    10

head(books_raw$full_data)
#>                         timestamp
#> 1 Tue, 10 Jan 2023 00:00:00 +0000
#> 2 Fri, 13 Jan 2023 00:00:00 +0000
#> 3 Sat, 14 Jan 2023 00:00:00 +0000
#> 4 Thu, 19 Jan 2023 00:00:00 +0000
#> 5 Sun, 22 Jan 2023 00:00:00 +0000
#> 6 Thu, 26 Jan 2023 00:00:00 +0000
#>                                                                            book_title
#> 1                                                                     The Actual Star
#> 2          The Secret Life of Groceries: The Dark Miracle of the American Supermarket
#> 3                                       Prince Caspian (The Chronicles of Narnia, #4)
#> 4                       The Voyage of the Dawn Treader (The Chronicles of Narnia, #3)
#> 5                                                                     Spinning Silver
#> 6 American Midnight: The Great War, a Violent Peace, and Democracy's Forgotten Crisis
#>       book_author rating read_year read_month read_month_fct
#> 1    Monica Byrne      2      2023          1        January
#> 2   Benjamin Lorr      5      2023          1        January
#> 3      C.S. Lewis      5      2023          1        January
#> 4      C.S. Lewis      5      2023          1        January
#> 5     Naomi Novik      5      2023          1        January
#> 6 Adam Hochschild      5      2023          1        January
8.2.3 With Observable
And we can use it with Observable:
8.3 Current plumber.R file
Here’s what the API is looking like now with our extra annotations, error handling, and CORS.