With Make handling all the tricky issues with logging into services and regularly grabbing data from them and inserting that data into Google Sheets and/or Airtable, we only need to worry about accessing that data through Google Sheets and/or Airtable. There’s no need to also log into Fitbit or Goodreads or whatever other service we want to use. Everything is centralized in an easy-to-access place (Google Sheets or whatever) and everything runs automatically behind the scenes for us. This is fantastic.
5.1 Why even do this?
To make life easier, we can build a way to access that centralized data so we can use it with R or Python or JavaScript or whatever else we want.
Technically we don’t have to do this. We can access the Goodreads Google Sheet directly with the {googlesheets4} package or access the Fitbit Airtable database with the {airtabler} package, like this:
library(tidyverse)library(googlesheets4)gs4_deauth() # The sheet is public so there's no need to log inlocal_gs4_quiet() # Turn off the googlesheets messagesbooks_raw <-read_sheet("https://docs.google.com/spreadsheets/d/1oQqX4G4CJaa7cgfsEW4LeorcQwxVeYe0Q83WrJbcN6Y/edit#gid=0")last_five_books <- books_raw |>mutate(timestamp =dmy_hms(user_read_at)) |>arrange(desc(timestamp)) |>select(timestamp, author_name, title) |>slice(1:5)last_five_books
# A tibble: 5 × 3
  timestamp           author_name      title
  <dttm>              <chr>            <chr>
1 2024-01-06 00:00:00 Ada Palmer       Seven Surrenders (Terra Ignota, #2)
2 2023-12-31 00:00:00 Sara Pennypacker Pax, Journey Home (Pax, #2)
3 2023-12-29 00:00:00 Sara Pennypacker Pax (Pax #1)
4 2023-12-28 00:00:00 Saladin Ahmed    From a Certain Point of View: Return of …
5 2023-12-27 00:00:00 Ada Palmer       Too Like the Lightning (Terra Ignota, #1)
But the data in the Google Sheet is fairly raw, with dozens of columns, some of which need to be maniuplated and cleaned (like that user_read_at column, which is just text, but is technically a date). If we’re going to reuse this data a lot (like in a dashboard, or some other place), we don’t want to keep cleaning the raw data over and over again. It’d be cool if we could just grab pre-cleaned data.
5.2 Custom results with a centralized API
The {plumber} package lets us do this in a surprisingly easy way. With {plumber} we can create API endpoints that run specific functions that output data or images or text.
These endpoints are all accessible with URLs—we can visit a URL like api.whatever.com/books and get a clean version of the books data. We could even pass extra arguments like api.whatever.com/books?start_date=2022-01-01 and retrieve data from that date. The API lets you (or anyone else, if you make it public) access data without needing to install or run R or Python or anthing else—the data is all just accessible with URLs.
People use {plumber} in real world production environments too. For example, {plumber} fits directly in the {tidymodels} ecosystem with {vetiver}, and users can access the results of models with just a URL.
It’s magical.
5.3 Super basic example
Before showing how to create {plumber} API endpoints to get and clean data from Google, we’ll first look at how ridiculously easy it is to make a basic working API.
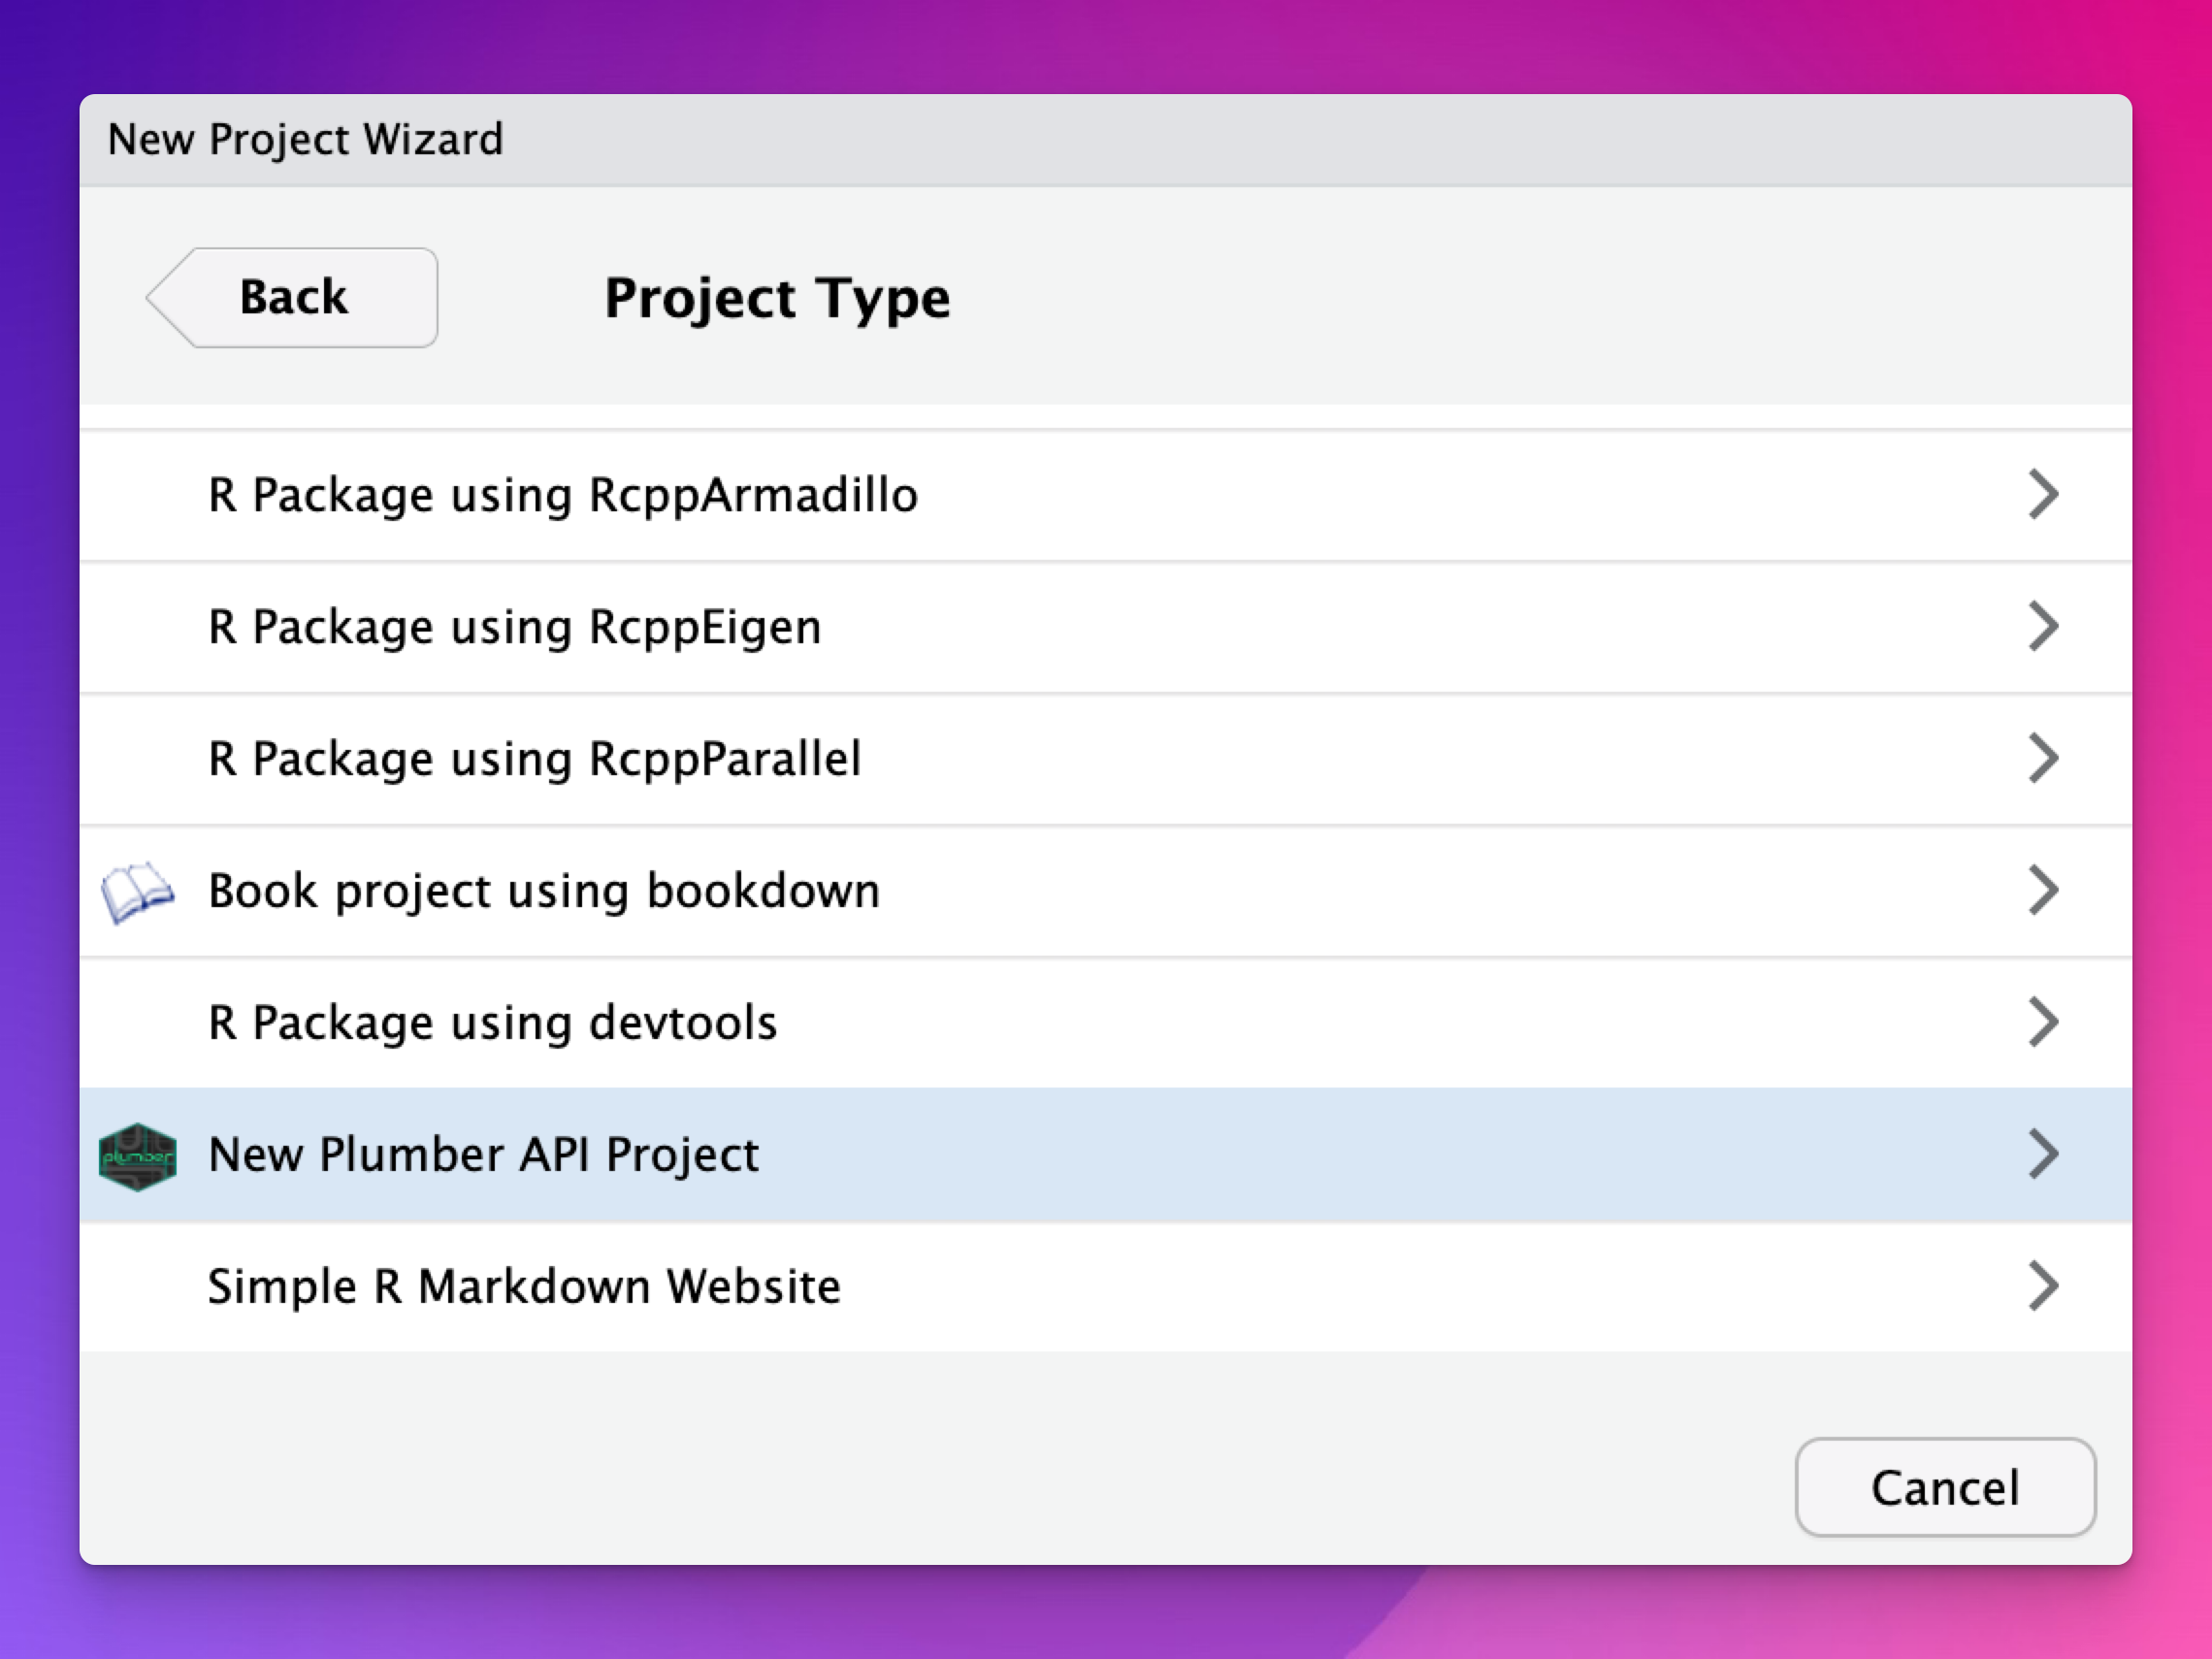
Install the {plumber} package, then in RStudio go to File > New Project… and scroll down to “New Plumber API Project”
New Plumber API project
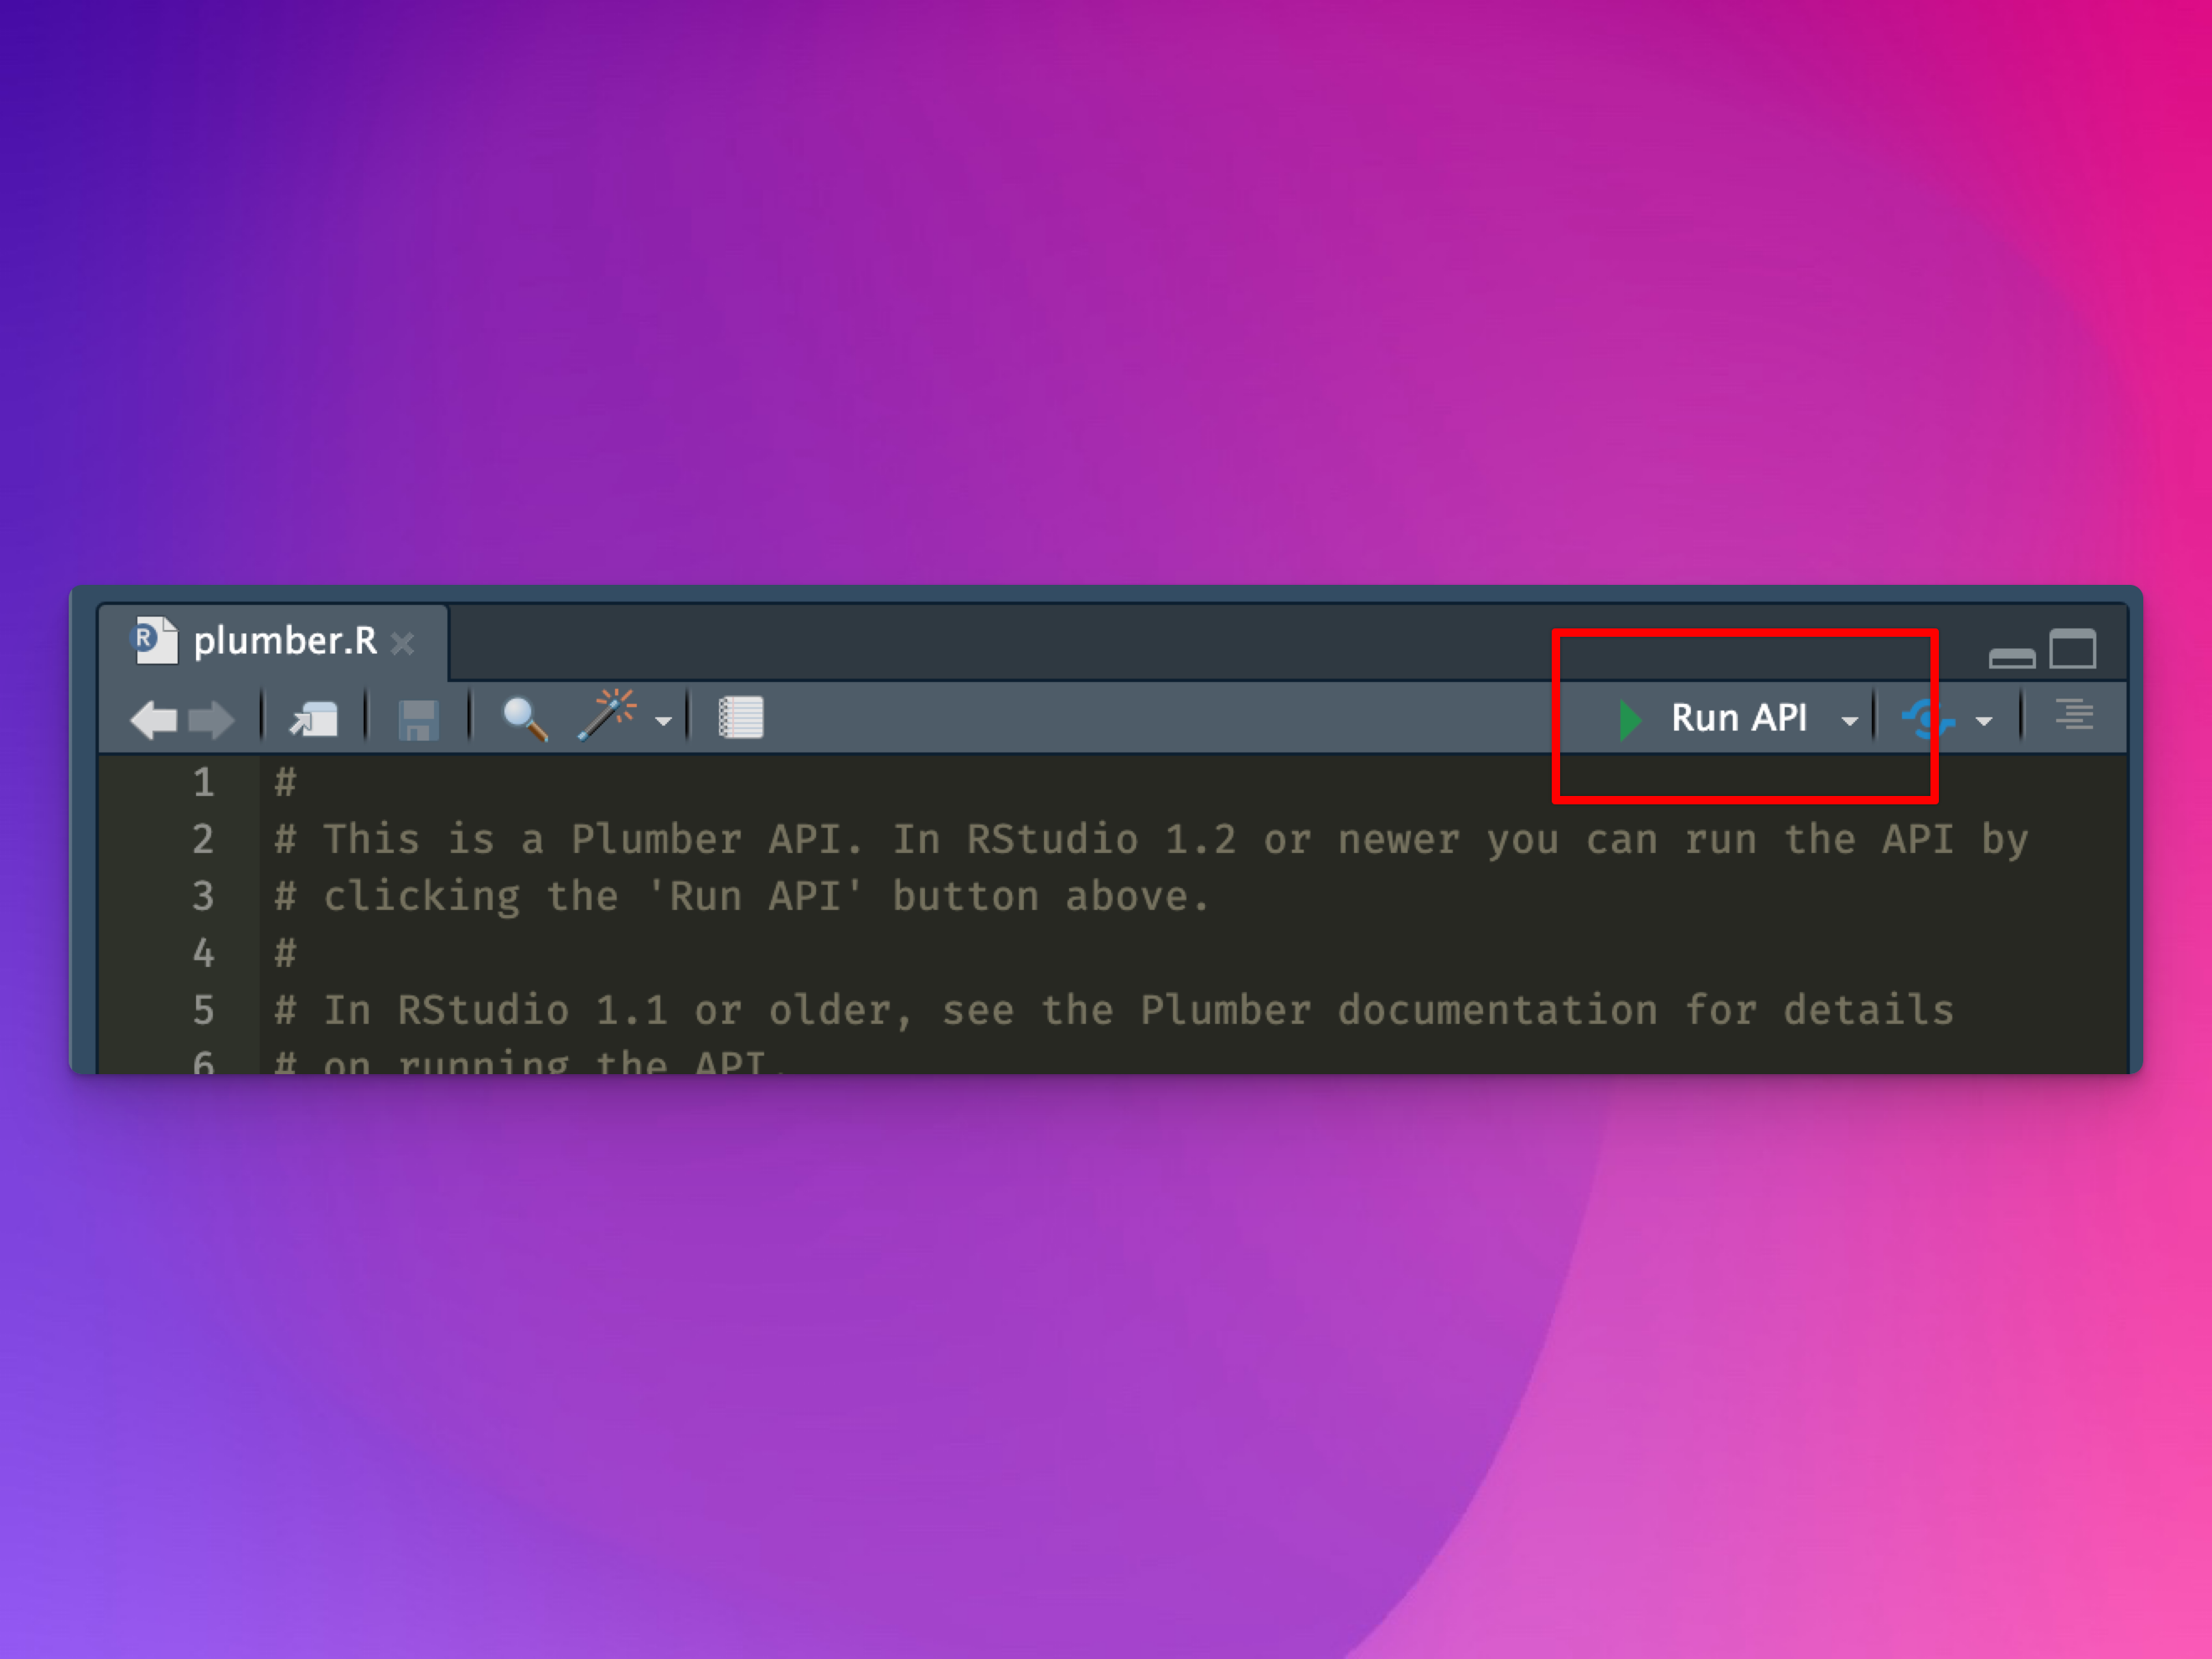
RStudio will automatically create a new folder on your computer with a new file named plumber.R in it with three example endpoints.
Open plumber.R in RStudio and click on the little “Run API” button in the top corner of the editor window:
Run API button
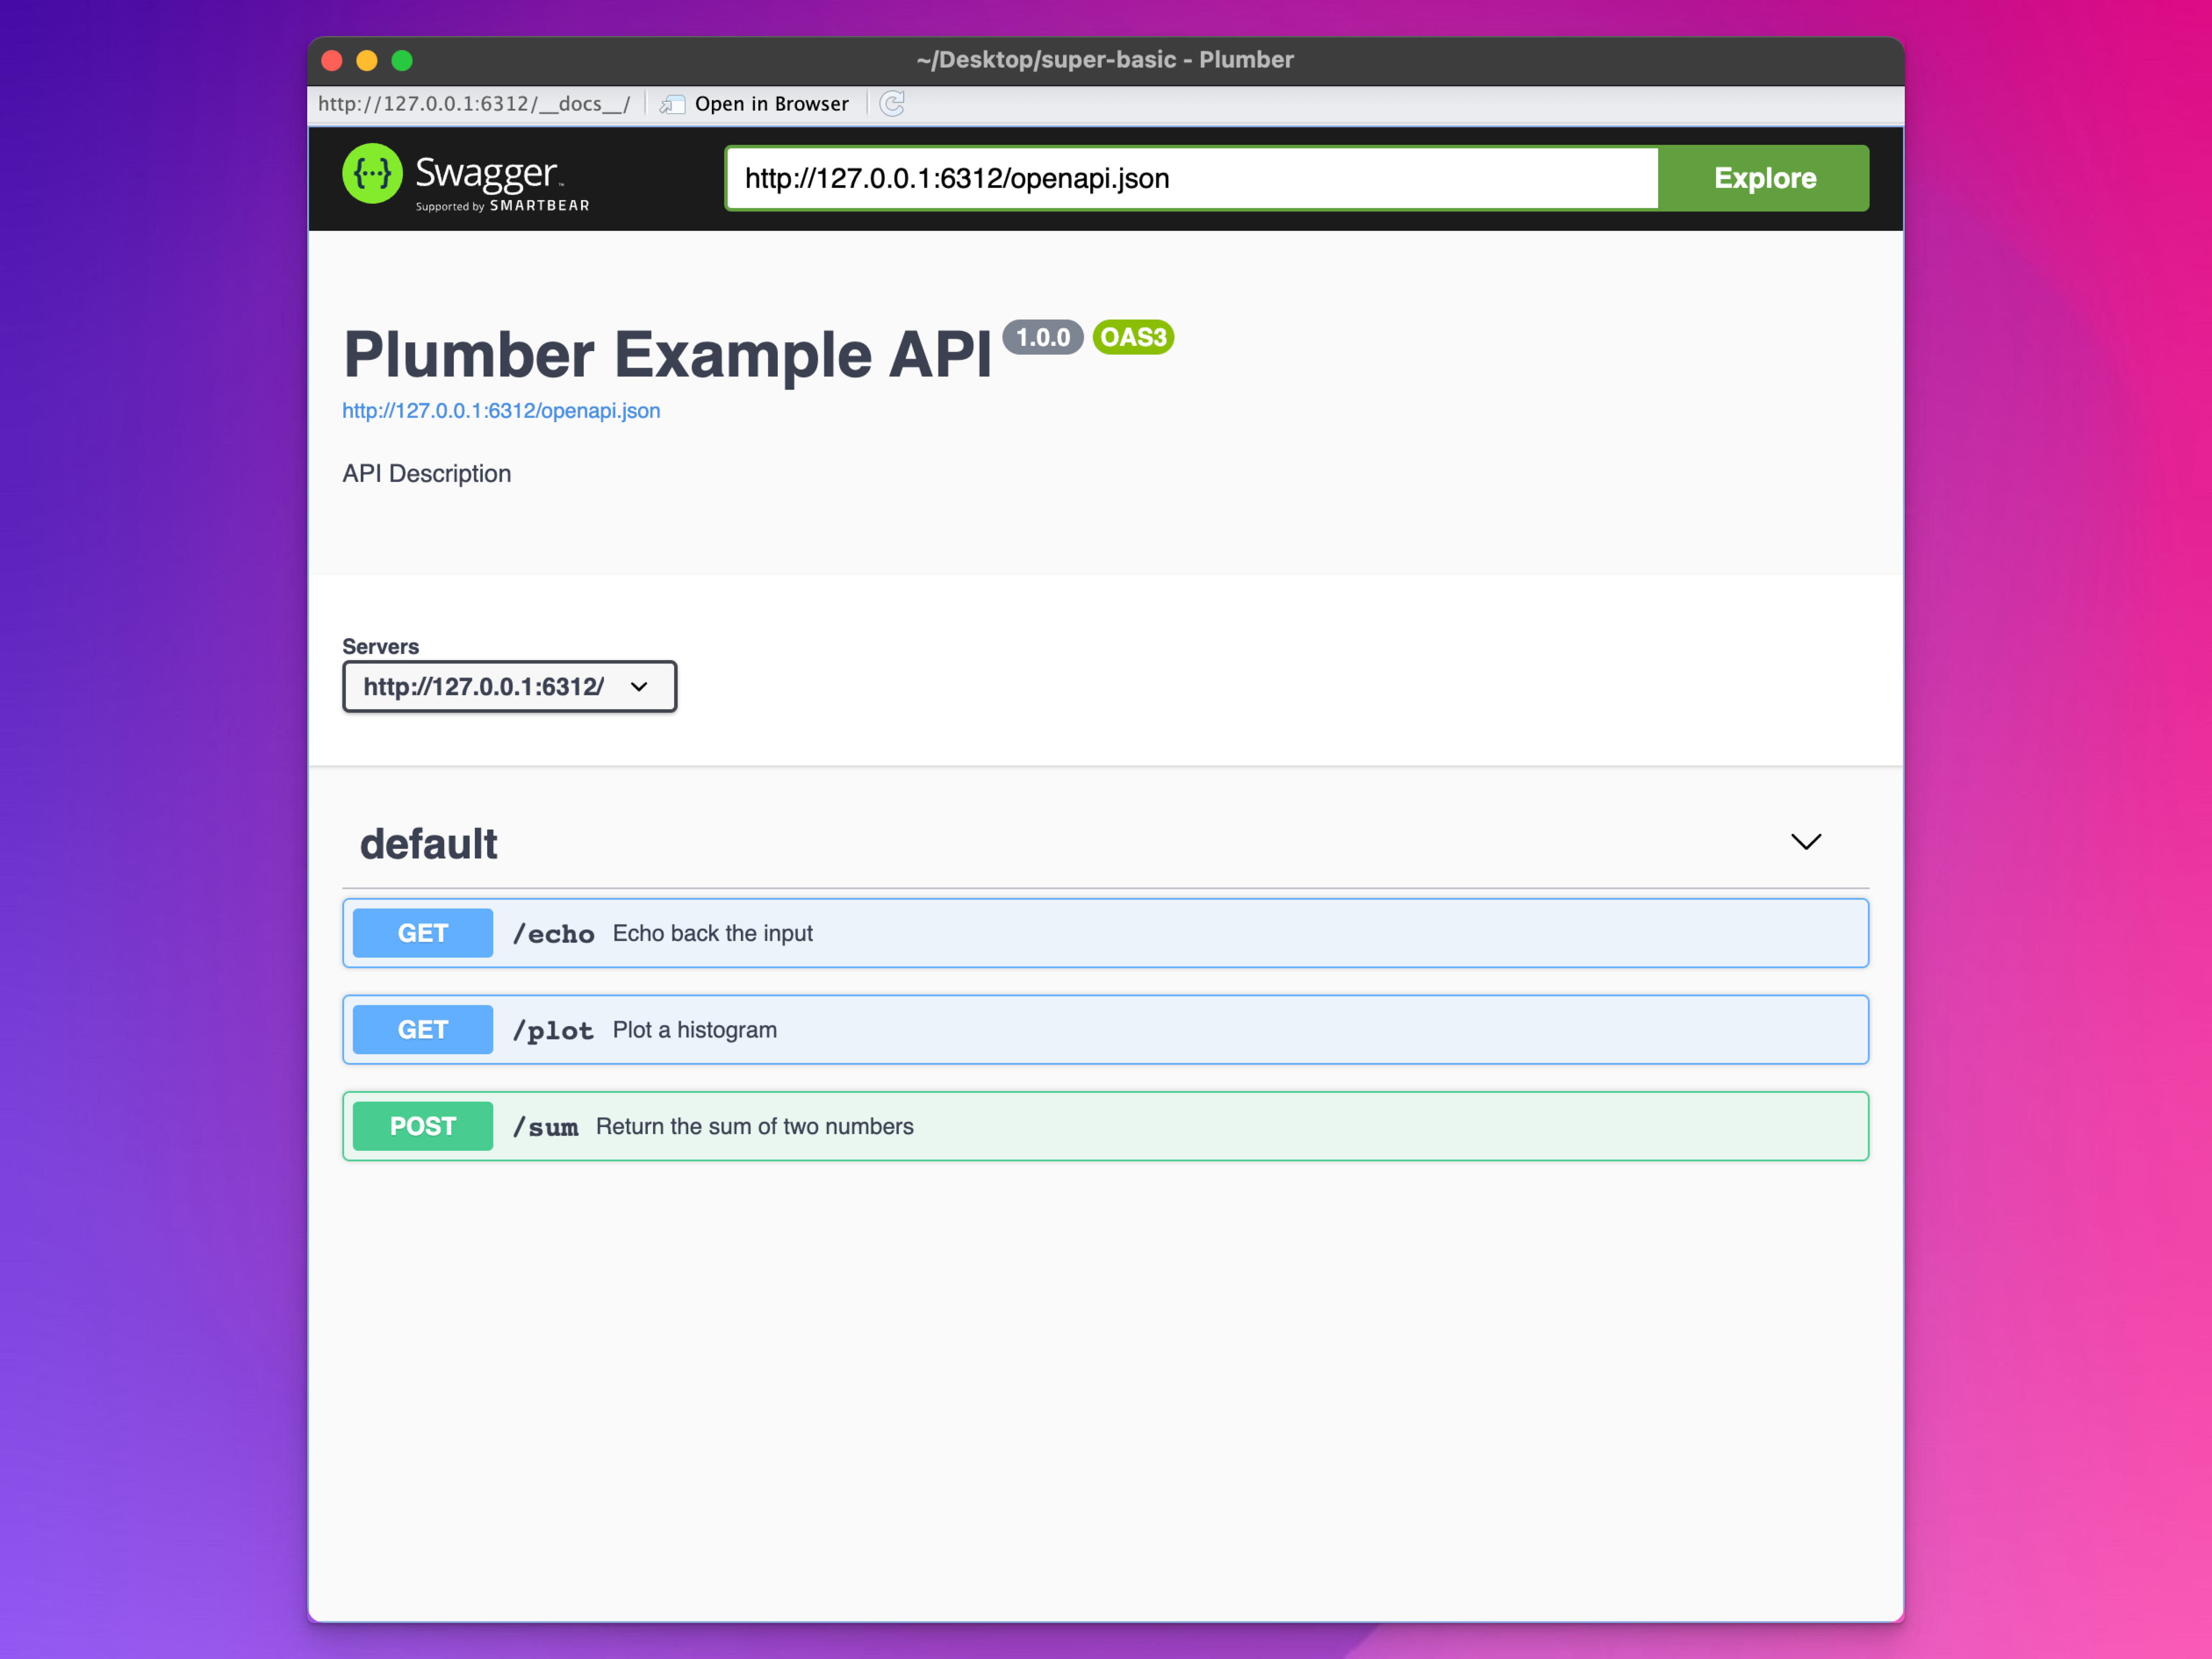
R will create a new local web server with a working API and open its documentation. In this case, the URL is http://127.0.0.1:6312, and the documentation is at http://127.0.0.1:6312/__docs__/. To make sure it’s always at the same port, we can include this line in the code:
options("plumber.port"=6312)
Example API documentation
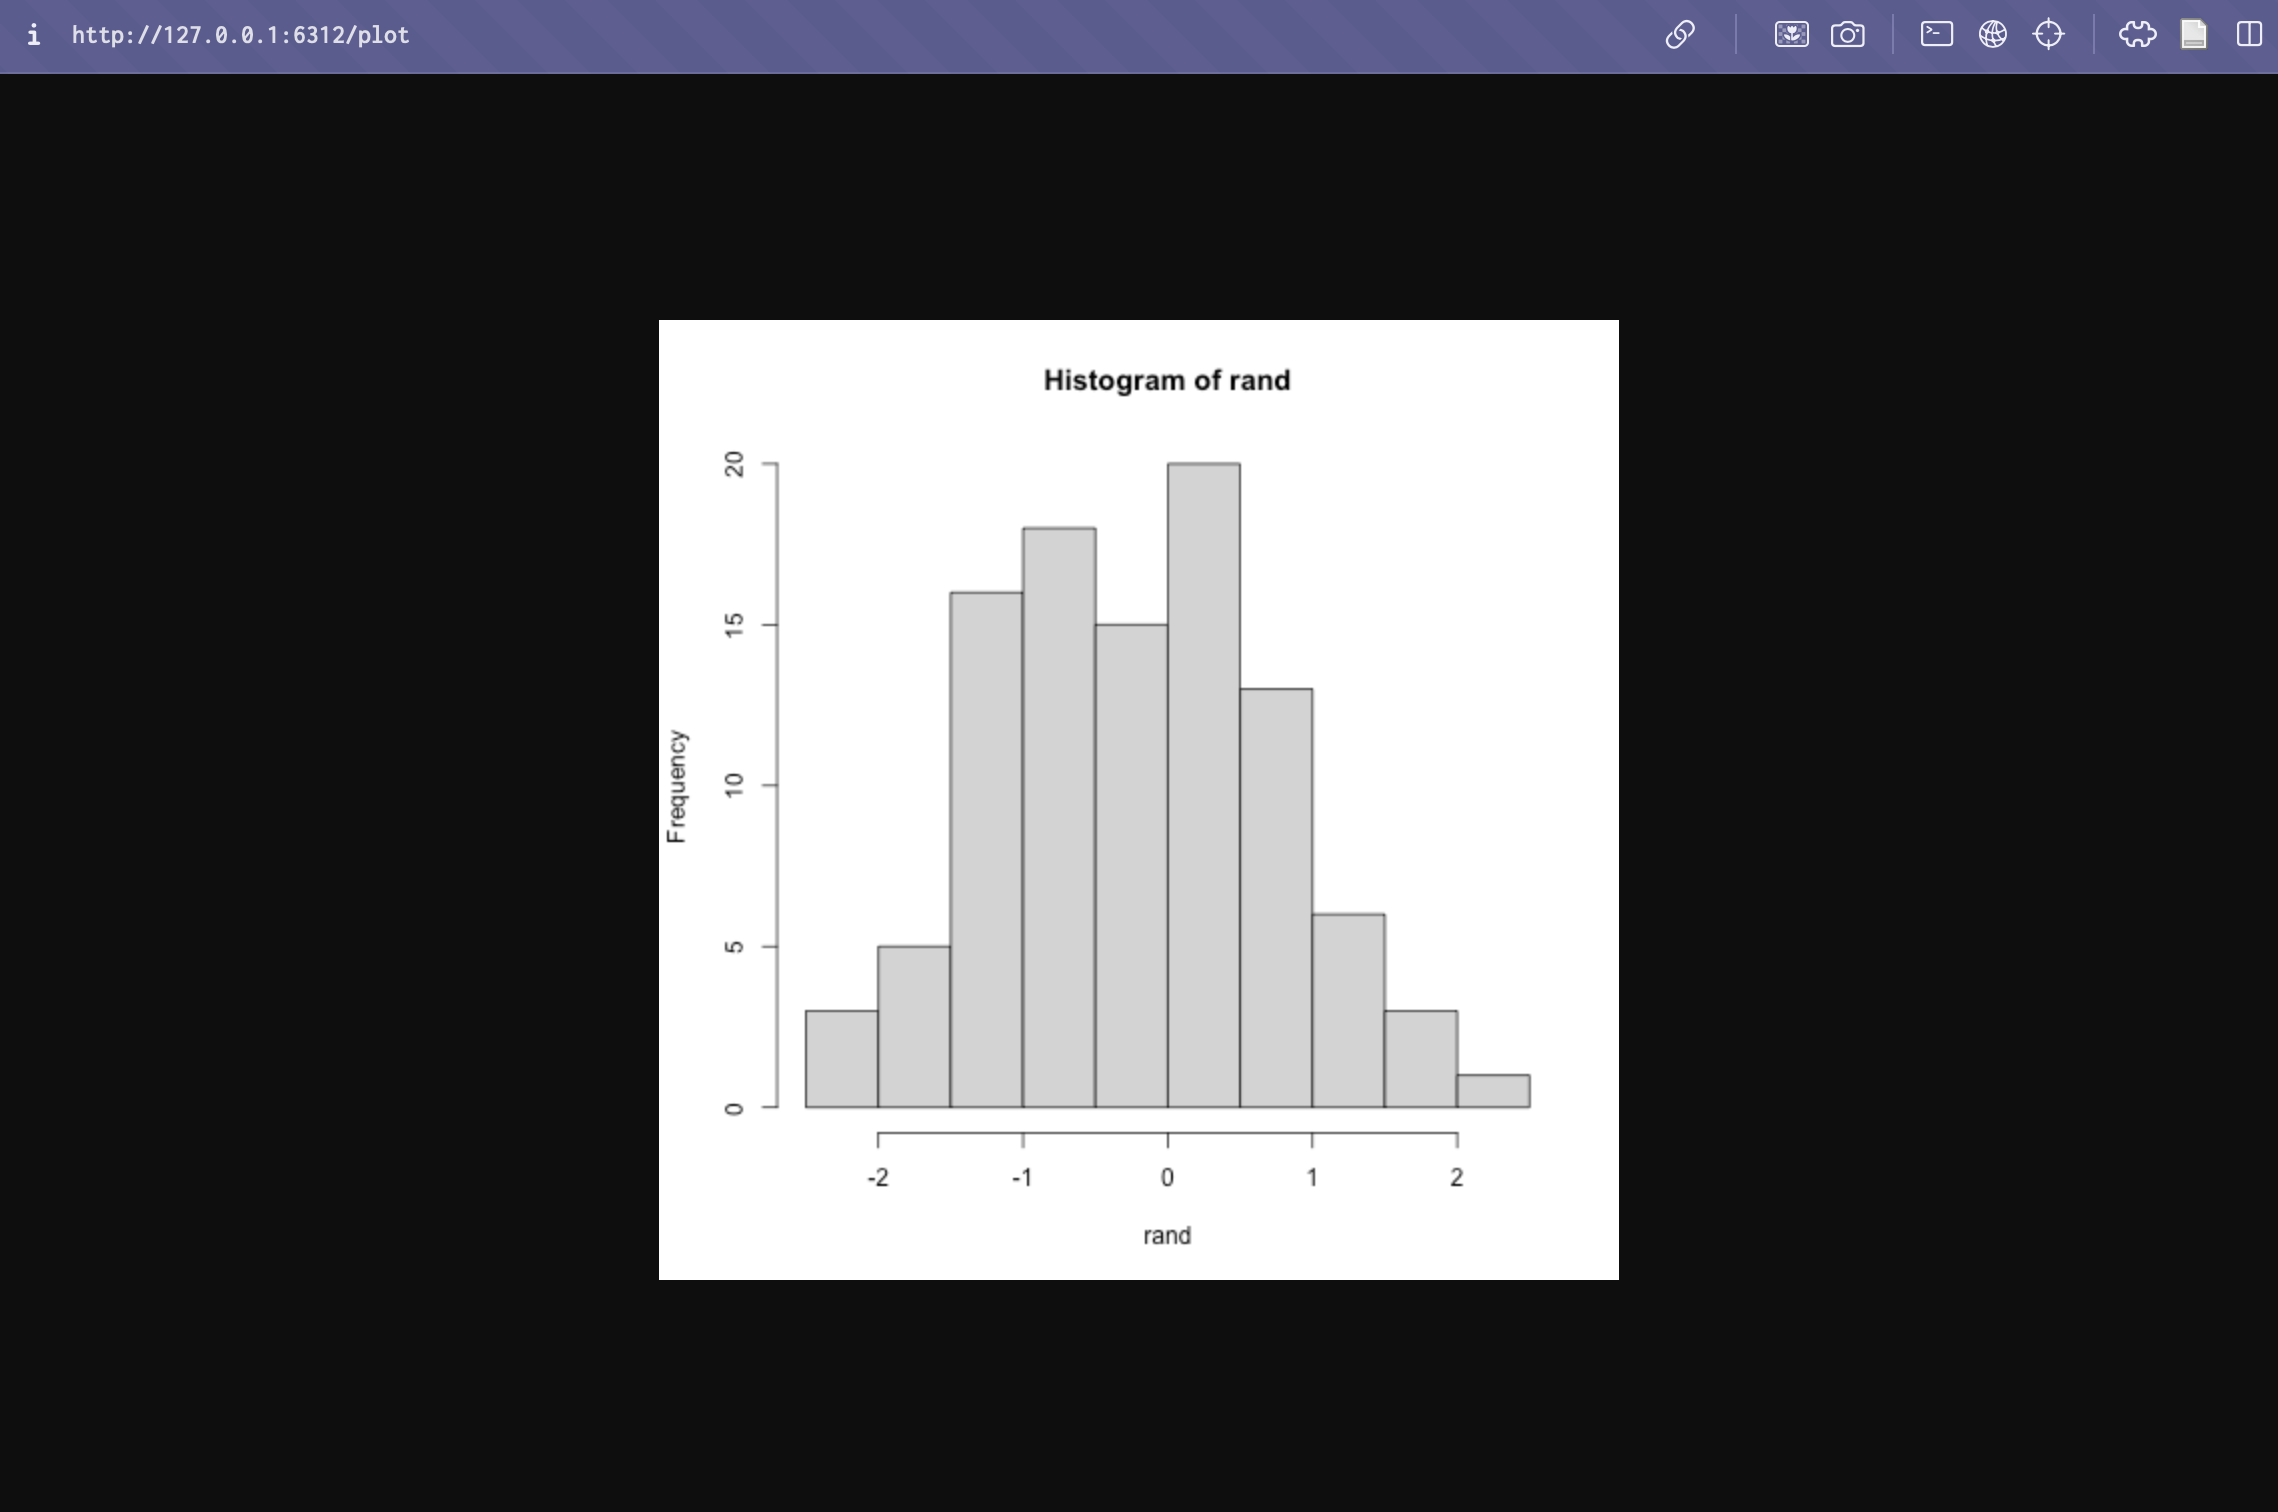
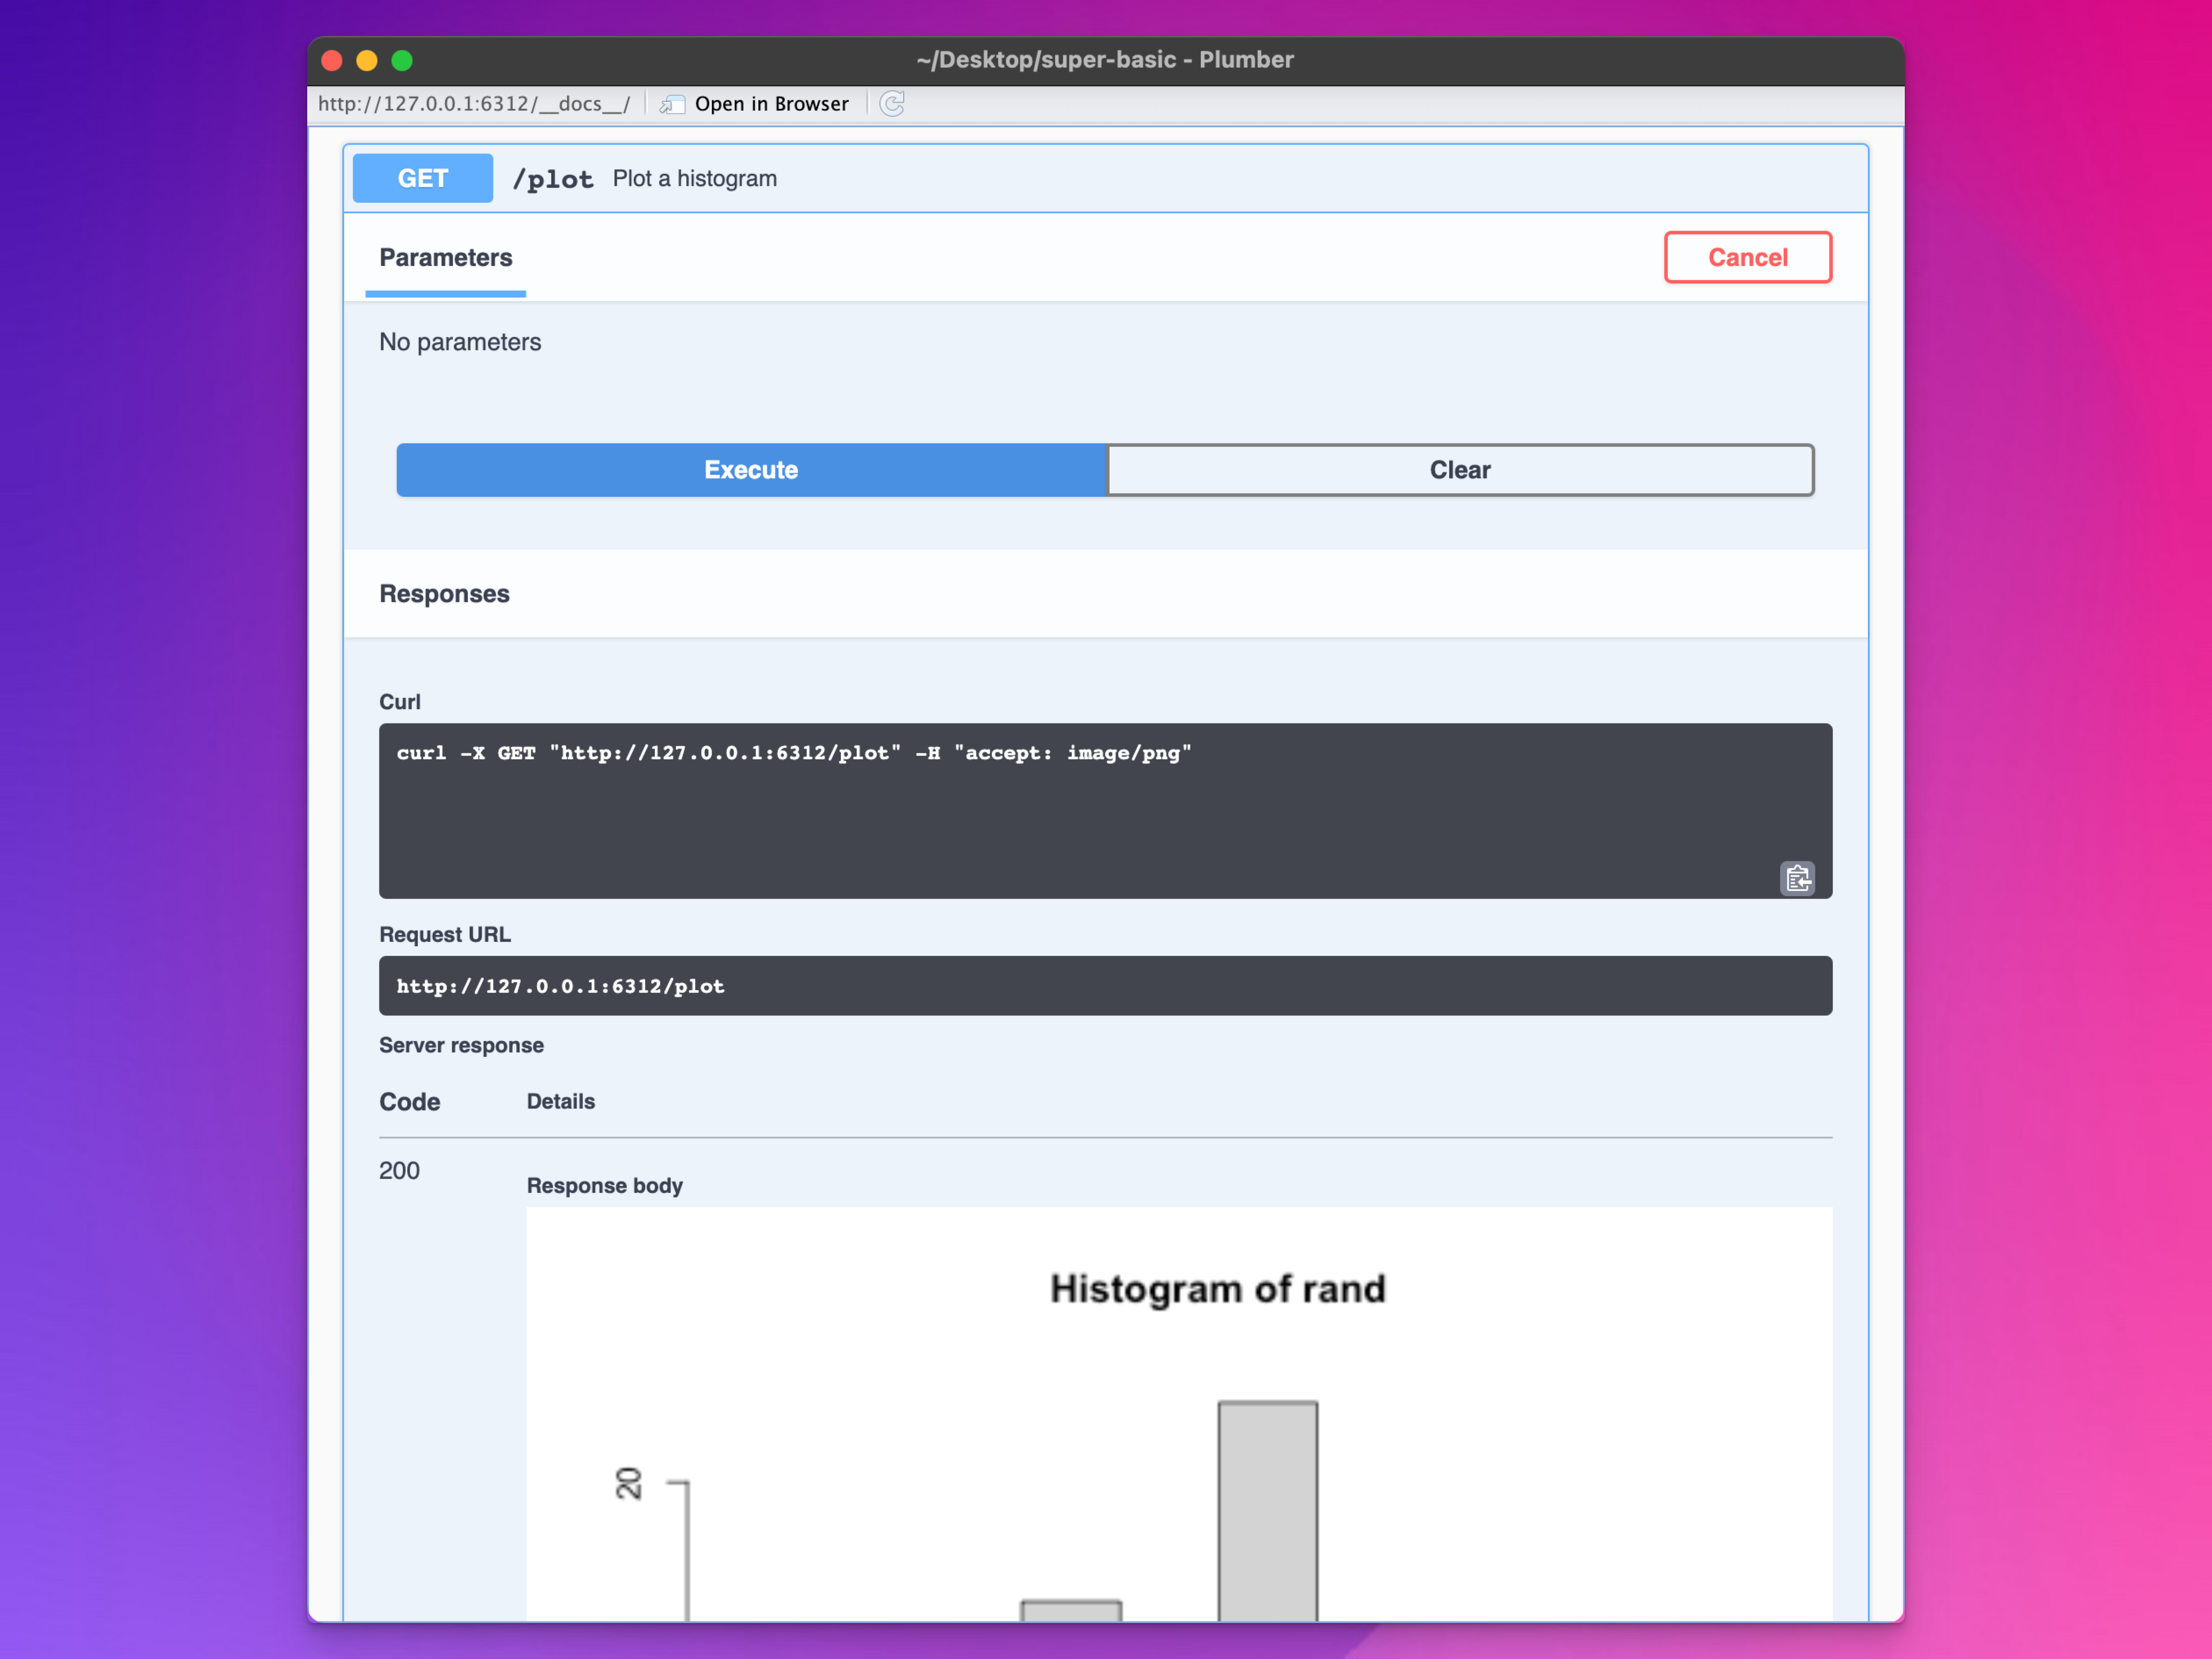
To see if everything is working, open a browser and visit http://127.0.0.1:6312/plot (but change the URL to whatever it is on your computer). You should see a randomly generated histogram!
Example histogram
You can also use the API documentation to test it out. Click on the /plot entry, then click on “Try it out”, and then click on “Execute”. It will create the same URL and show the results in the little window
Histogram in the documentation
This all works because of this R code:
#* Plot a histogram#* @serializer png#* @get /plotfunction(){ rand <-rnorm(100)hist(rand)}
All the of the special API-related settings come from the #* comments. The #* @get /plot part sets up an endpoint with the URL /plot that outputs a PNG file (#* @serializer png) of the results of the function, which generates 100 random numbers and plots a histogram.
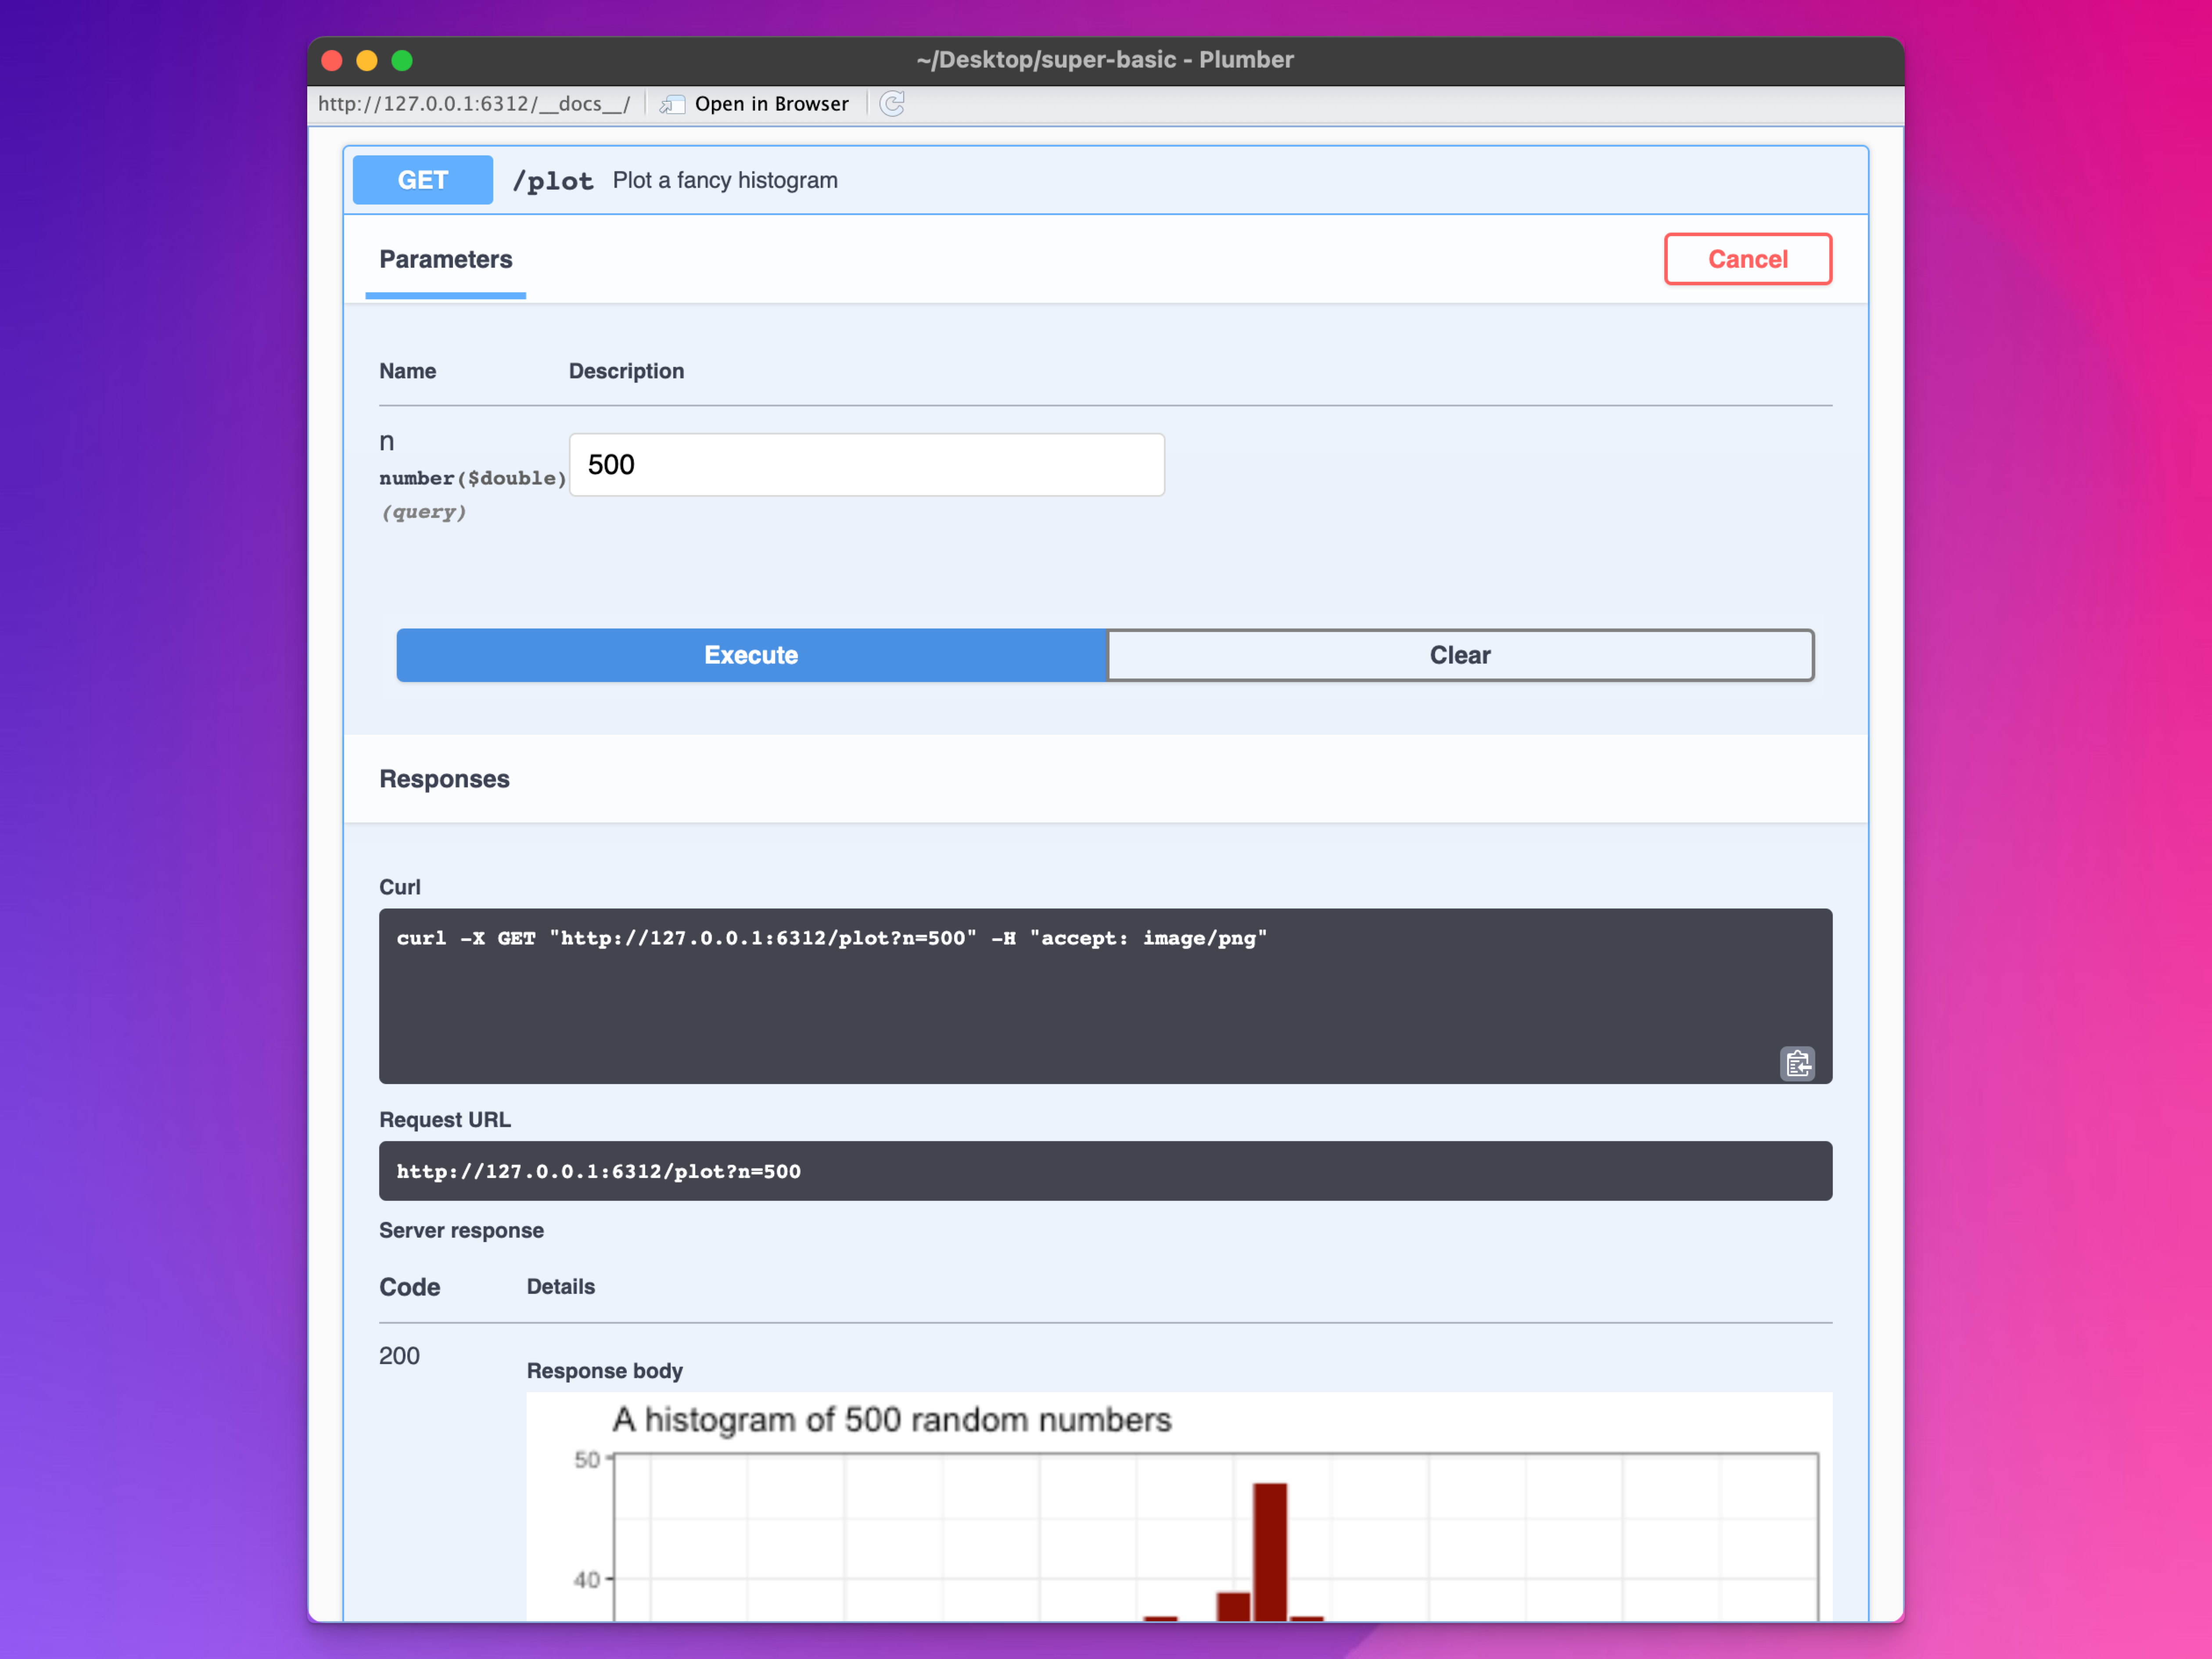
Right now this function doesn’t take any arguments, but it could. For fun, replace that histogram function with this instead:
#* Plot a fancy histogram#* @serializer png list(width = 500, height = 300)#* @get /plotfunction(n =100) {library(ggplot2)library(glue)# Make sure n isn't ever too big so that the server doesn't crashif (n >=10000) {stop("`n` is too big. Use a number less than 10,000.") } my_plot <-ggplot(data =data.frame(x =rnorm(n)),aes(x = x) ) +geom_histogram(fill ="darkred", color ="white") +labs(title =glue("A histogram of {n} random numbers")) +theme_bw()print(my_plot)}
Reload the API and look at the documentation. There’s now a field for n where you can tell R how many random numbers to generate, and it’s 100 by default. Change it to something else and run the command there (or visit http://127.0.0.1:6312/plot?n=500 or whatever in your browser):
Fancy histogram!
Now we’re using ggplot to create a histogram of 500 numbers and the PNG file is 500×300 pixels!
5.4 Basic JSON example
One last little example before showing how to make API endpoints for Goodreads and Fitbit. It’s more often the case that you’ll want to get data out of the API, not just images. Spitting out JSON-formatted data is really easy too. Stop your local API, add this to plumber.R, and restart the API:
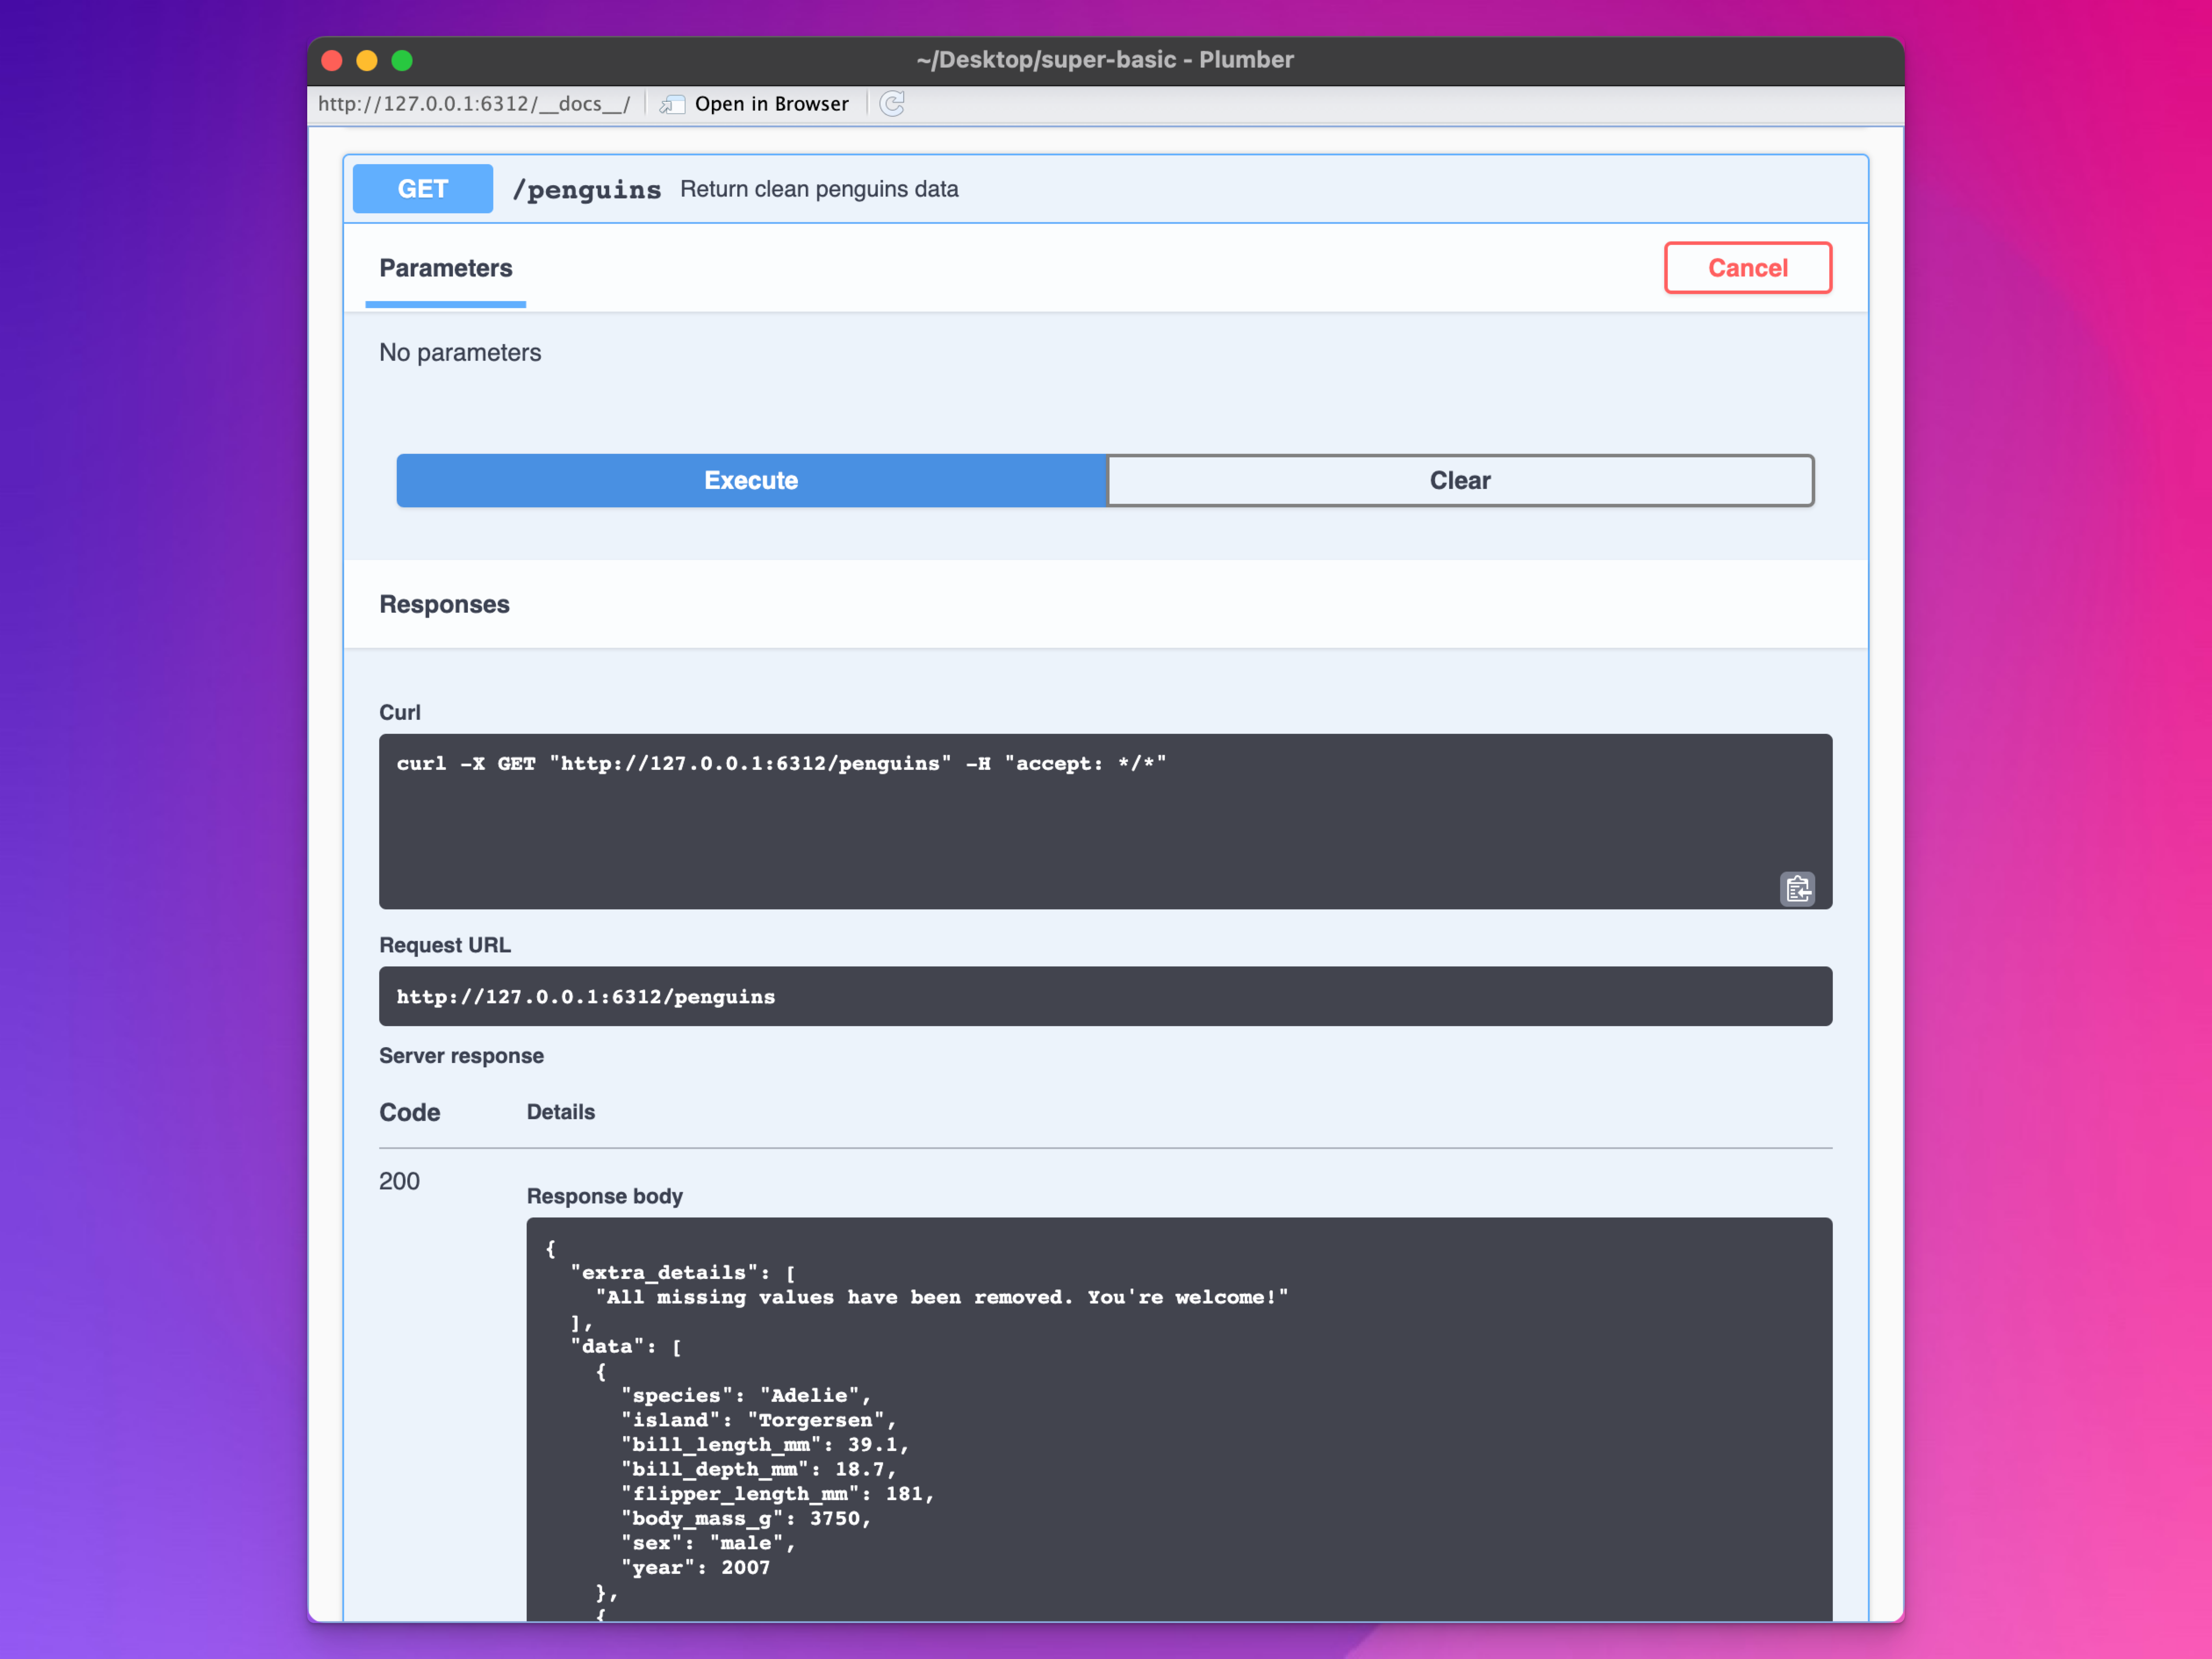
Visit the /penguins URL either in your browser or through the documentation and you’ll get a JSON file with an element for extra_details and an element for data. That extra_details part is completely optional—it’s just to show how you can create JSON structured in any way you want, with whatever data you want.
{"extra_details":["All missing values have been removed. You're welcome!"],"data":[{"species":"Adelie","island":"Torgersen","bill_length_mm":39.1,"bill_depth_mm":18.7,"flipper_length_mm":181,"body_mass_g":3750,"sex":"male","year":2007},...],...}
Penguins as JSON
Now you can use the cleaned penguins data wherever you want! Like with R:
library(jsonlite)penguins_raw <-read_json("http://127.0.0.1:6312/penguins", # Automatically convert dataframe-like elements to data framessimplifyVector =TRUE)penguins_raw$extra_details#> [1] "All missing values have been removed. You're welcome!"head(penguins_raw$data)#> species island bill_length_mm bill_depth_mm flipper_length_mm body_mass_g sex year#> 1 Adelie Torgersen 39.1 18.7 181 3750 male 2007#> 2 Adelie Torgersen 39.5 17.4 186 3800 female 2007#> 3 Adelie Torgersen 40.3 18.0 195 3250 female 2007#> 4 Adelie Torgersen 36.7 19.3 193 3450 female 2007#> 5 Adelie Torgersen 39.3 20.6 190 3650 male 2007#> 6 Adelie Torgersen 38.9 17.8 181 3625 female 2007
Or with Observable:
```{ojs}//| echo: fencedd3 =require('d3')penguins = await d3.json(// This is my live API so it runs in your browser.// Use your local API URL on your computer."https://api.andrewheiss.com/penguins")penguins.extra_details```
You don’t have to use JSON to pass data out of your API. You can use a bunch of different outputs like plain text, YAML, CSV, or even .rds files (for working directly in R). You also aren’t limited to just PNG for images—you can create JPEGs, SVGs, TIFFs, PDFs, and other files.
At the end of each page in this section, I’ll post a complete version of the plumber.R file. Here’s what we have so far. It is incredible that with just this, you can have a complete API!